使用 CLI
CLI 可以作为独立工具运行,也可以作为 kubectl 插件运行。 你可以将它从 netobserv-controller-manager pod 复制到本地机器。
当你需要在有限时间内检查 packets 或 flows 时,可使用 CLI 进行按需故障排查。 它支持以下两种模式:
- TUI 模式:实时显示捕获到的流量,便于交互式检查
- 后台模式:启动一个捕获任务,并让它持续运行,直到达到配置的停止条件或被手动停止
两种模式都支持导出捕获结果,以便进行离线分析。
复制 CLI
示例:
安装或复制 yq
CLI 需要本地机器上安装 yq,以便修改 YAML 文件。 如果本地未安装 yq,你可以从 netobserv-controller-manager pod 复制二进制文件。
CLI 使用了 NetObserv Operator 中打包的一些镜像,但它本身运行并不依赖于安装 NetObserv Operator。 在准备好 CLI 之后,如果你不再需要 NetObserv Operator,可以将其卸载。CLI 仍然可以继续工作。
查看帮助信息
在开始捕获任务之前,请先查看可用命令:
捕获 Packets
Packet capture 会记录与所指定过滤条件匹配的原始 packets。 当你需要完整的 packet 细节,而不是汇总后的 flow 记录时,请使用 packet capture。
如果 packet 长度大于 256 字节,该 packet 会在捕获结果中被截断。
捕获到的 packets 可以导出为 pcapng 文件,以便使用 Wireshark 等工具进行离线分析。
Wireshark 示例:
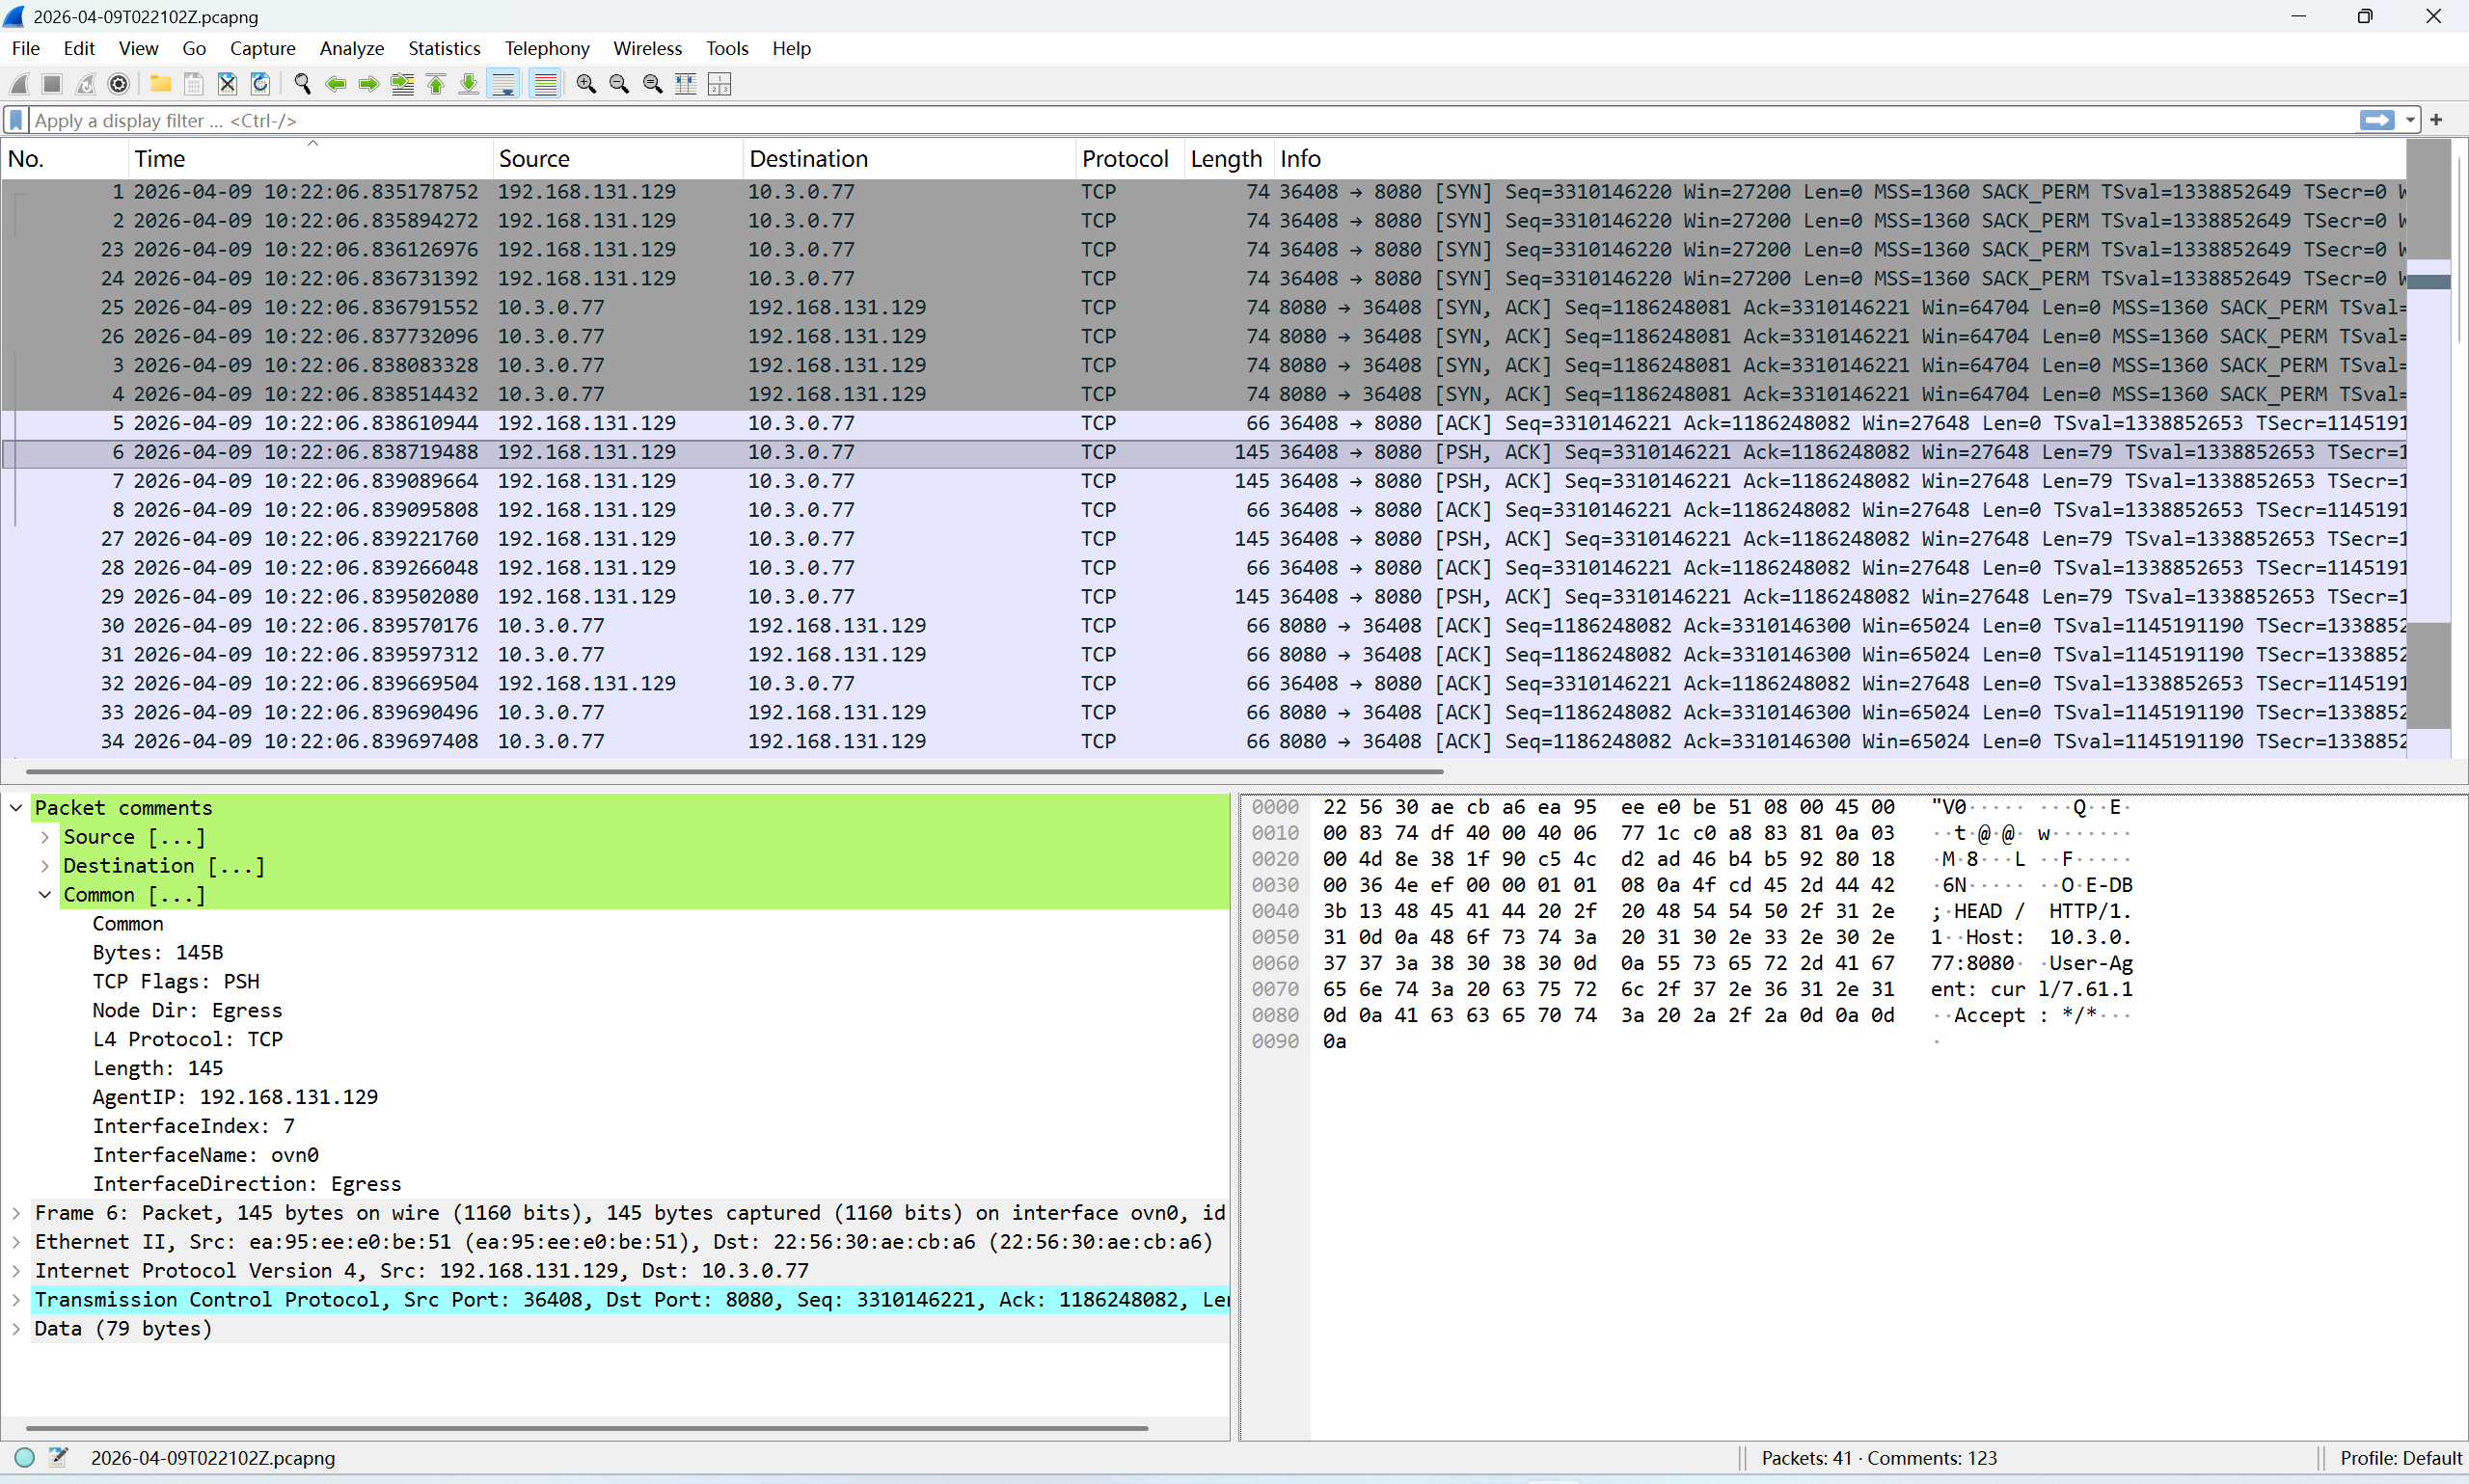
pcapng 文件中的捕获 packets 并不是按时间戳排序的,因此你可能需要在 Wireshark 中按时间戳对 packets 进行排序,以分析 packet 流。
packet 注释包含元数据,例如 node IP、接口名称以及 Kubernetes 资源信息。 示例 packet 注释:
你可以在 Wireshark 中基于这些注释过滤 packets。 以下示例按 node IP 和接口名称进行过滤:
在 Kube-OVN overlay 网络中,不同 node 上的 pod 之间的 packets 会使用 Geneve 或 VxLAN 进行封装。
原始 packet 会作为 Geneve 或 VxLAN packet 的 payload 传输。
要捕获已封装的流量,在运行 packet capture 命令时使用 --enable_geneve 或 --enable_vxlan。
捕获包含 Geneve 封装 packets 的 8080 端口 TCP packets 的示例命令:
在 TUI 模式下运行 Packet Capture
TUI 模式示例命令:
此命令会捕获与指定过滤条件匹配的 packets,并以 TUI 模式显示。
TUI 界面示例:
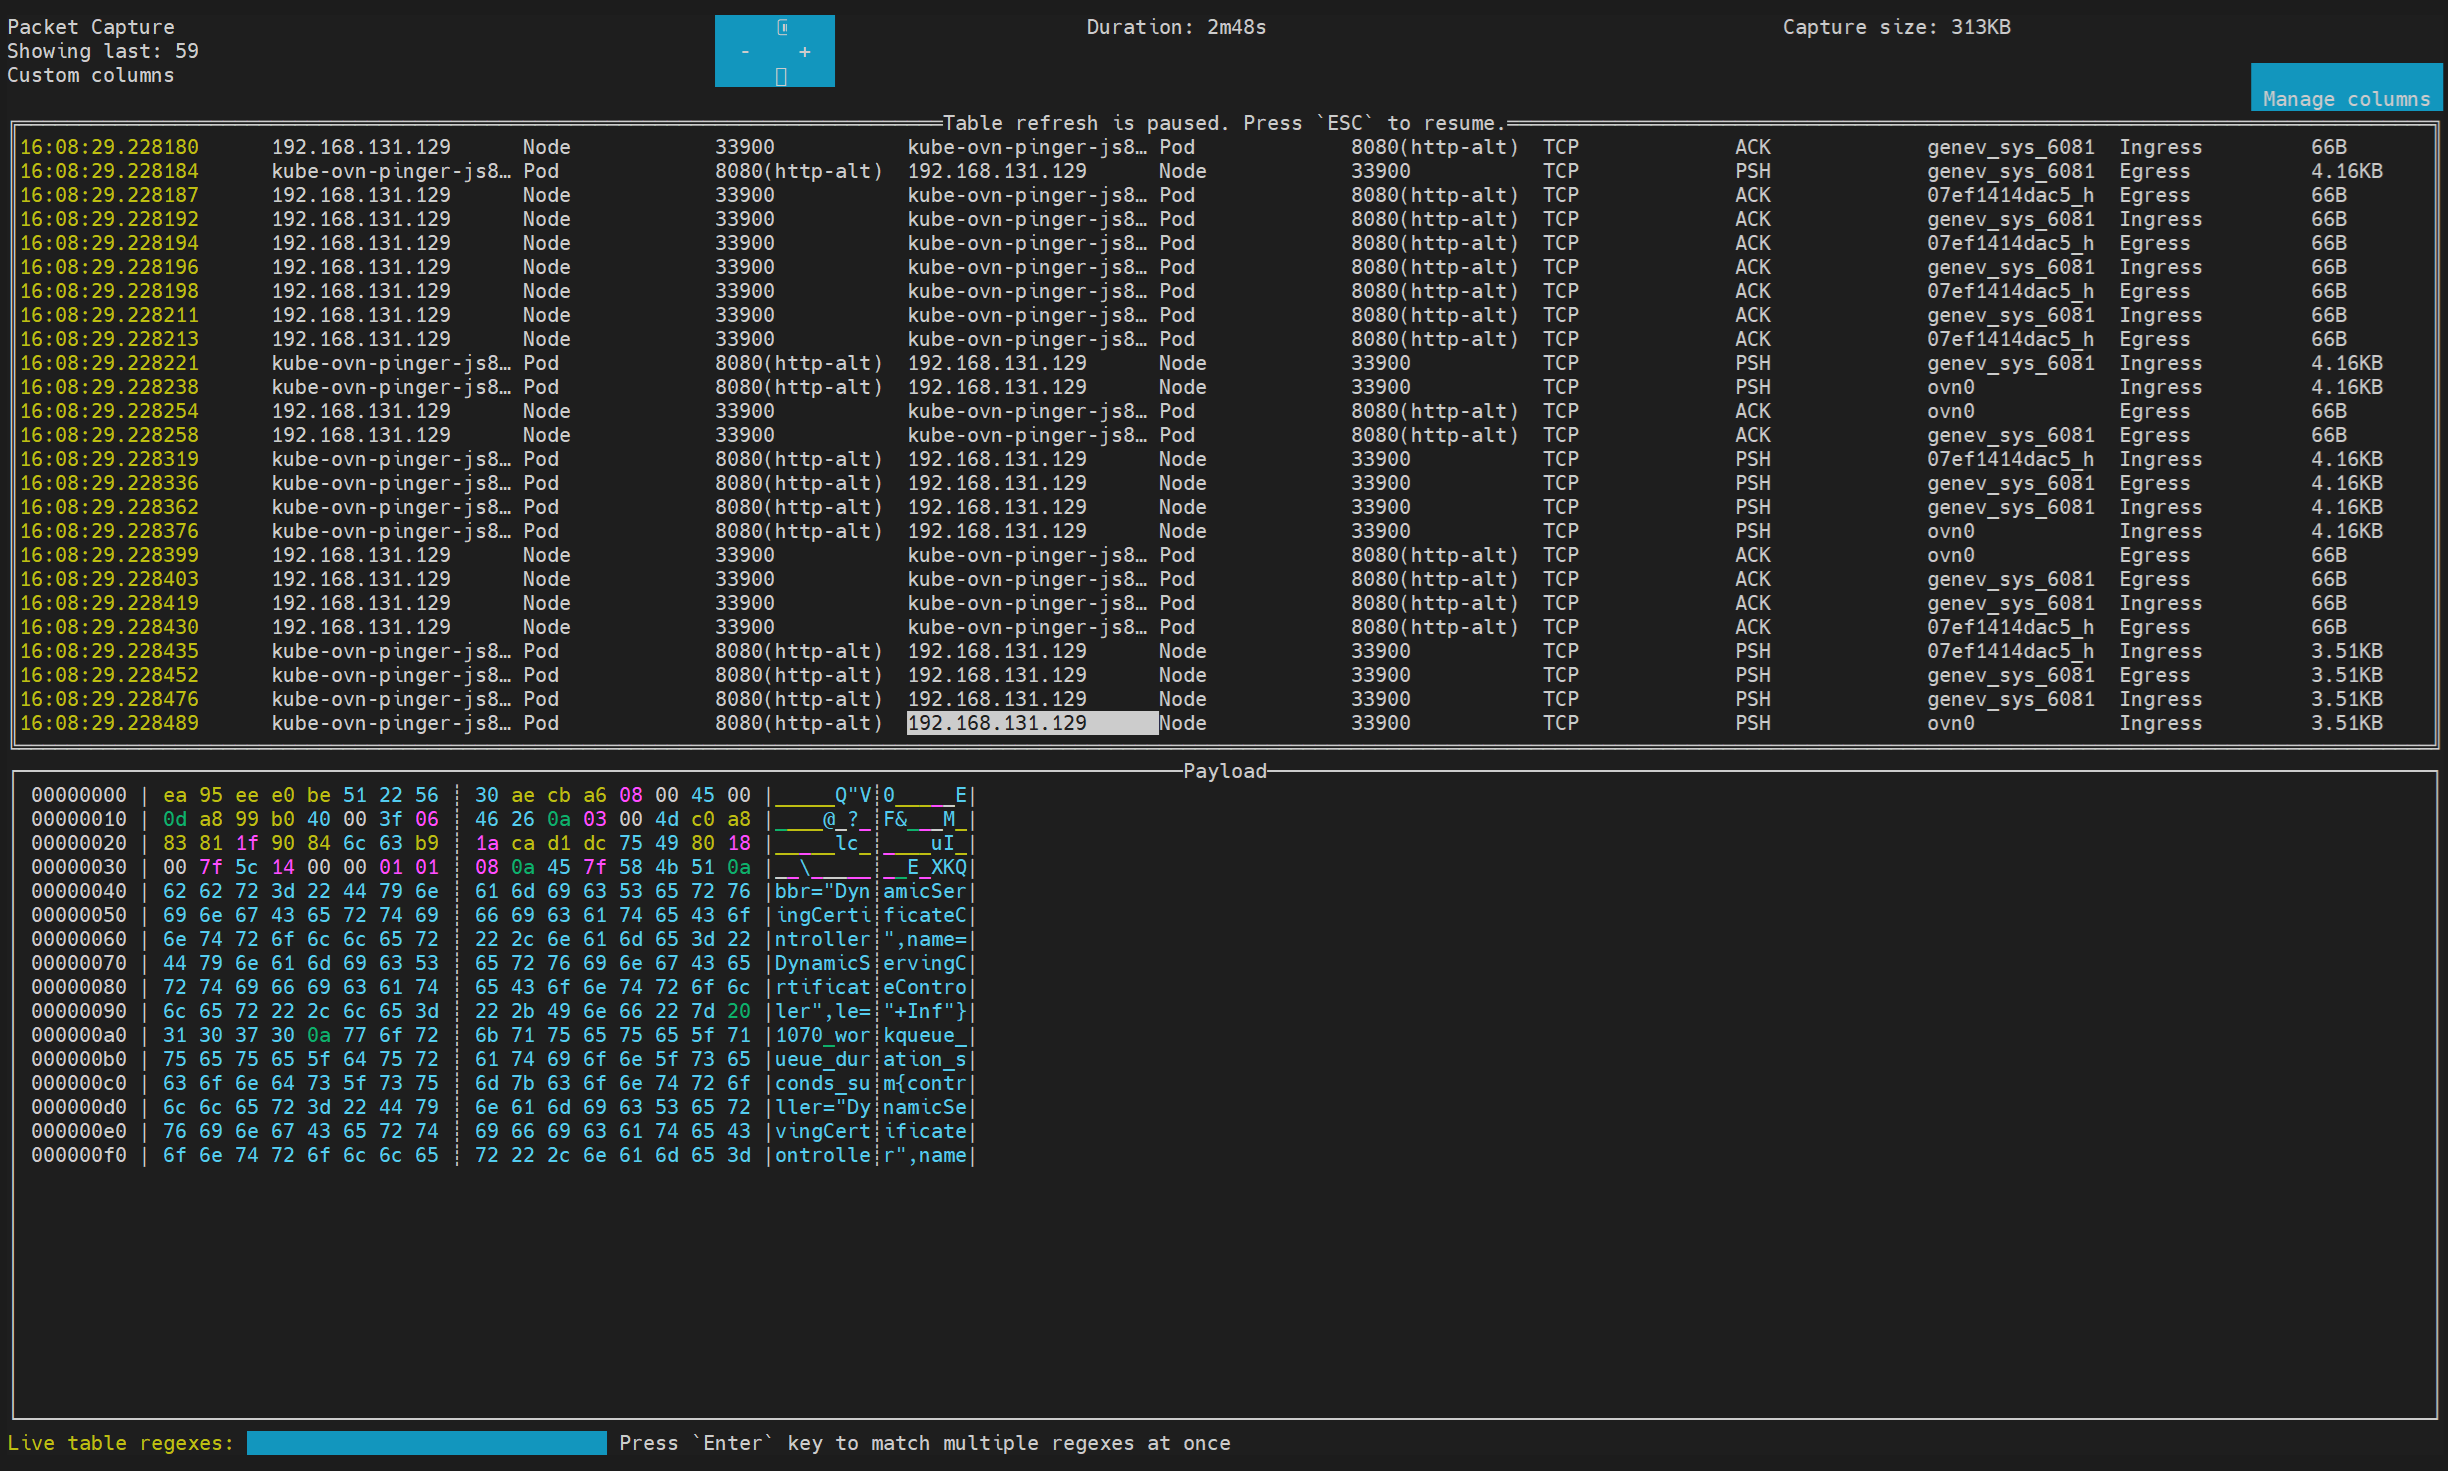
按 CTRL+C 可退出 TUI 模式并停止 packet capture。
默认情况下,退出 TUI 模式后,CLI 会询问你是否将捕获到的 packets 导出为 pcapng 文件。
你可以使用 --copy 标志自动保存 pcapng 文件,而无需确认。
在后台模式下运行 Packet Capture
后台模式示例命令:
此命令会在后台启动一个 packet capture 任务,用于捕获与指定过滤条件匹配的 packets。
要在后台模式下将捕获到的 packets 复制到 pcapng 文件中,请运行:
当捕获任务停止或完成后,你可以使用 cleanup 命令移除后台捕获任务并释放资源。
捕获 Flows
Flow capture 记录的是汇总后的网络 flow 数据,而不是原始 packets。 当你需要流量元数据和 flow 统计信息,而不是完整的 packet payload 时,请使用它。
flow capture 的用法与 packet capture 类似,但结果会以 JSON 和 SQLite 格式导出,而不是 pcapng。
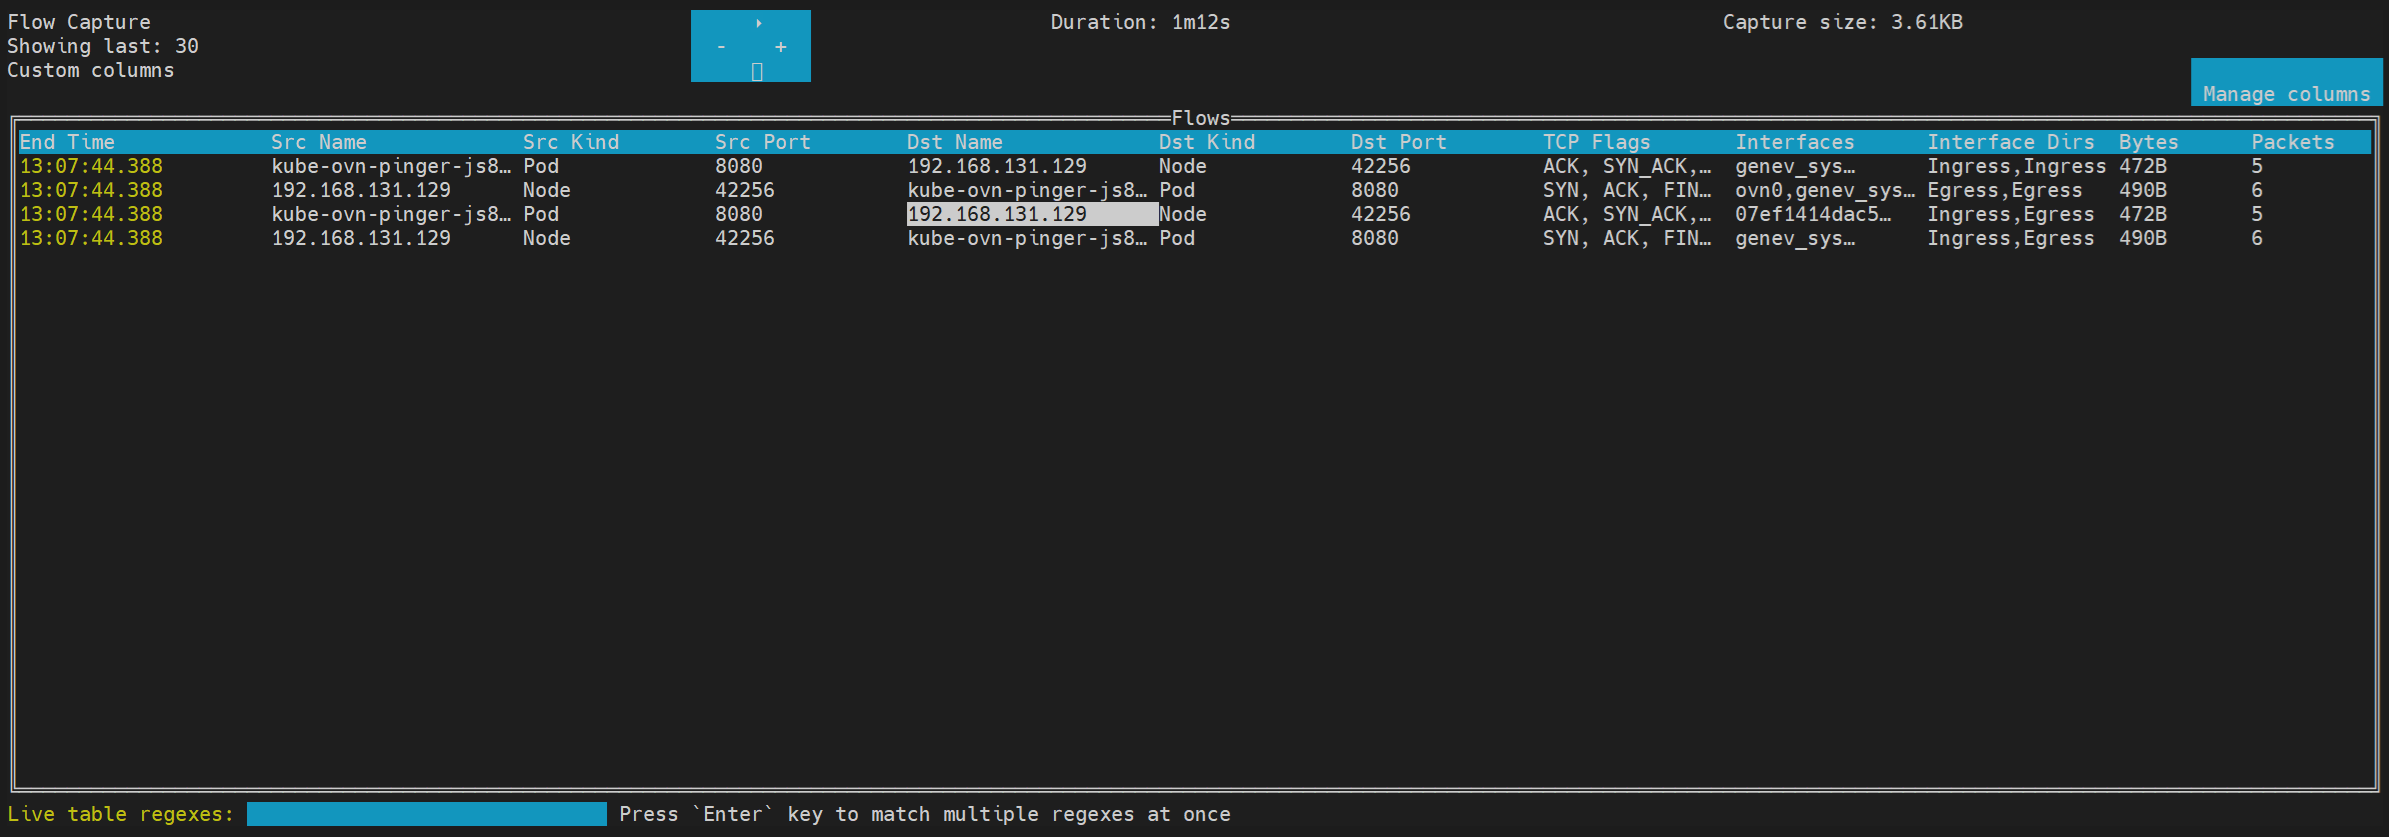
示例命令:
TUI 界面示例:
导出的 flow 记录示例,格式为 JSON:
导出的 SQLite 中的 flow 记录示例: