使用 CLI

CLI 可以作为独立工具运行,也可以作为 kubectl 插件运行。 你可以将其从 netobserv-controller-manager pod 复制到本地机器。

当你想在有限时间内检查数据包或流时,可使用 CLI 进行按需故障排查。 它支持以下两种模式:

  • TUI 模式:实时显示捕获到的流量,便于交互式检查
  • 后台模式:启动一个捕获任务,并让它持续运行,直到达到配置的停止条件或被手动停止

两种模式都支持导出捕获结果以供离线分析。

复制 CLI

示例:

# Get name of the NetObserv Controller Manager pod
CONTROLLER_POD=$(kubectl get pods -n netobserv-operator -l app=netobserv-operator -o jsonpath="{.items[0].metadata.name}")
# Copy the CLI from the controller manager pod to your local machine
kubectl cp netobserv-operator/$CONTROLLER_POD:/kubectl-netobserv /usr/local/bin/kubectl-netobserv
# Make the CLI executable
chmod +x /usr/local/bin/kubectl-netobserv
# Verify that the CLI is working
kubectl netobserv help

安装或复制 yq

CLI 需要本地机器上安装 yq,以便修改 YAML 文件。 如果本地未安装 yq,可以从 netobserv-controller-manager pod 复制二进制文件。

# Copy yq from the controller manager pod to your local machine
kubectl cp netobserv-operator/$CONTROLLER_POD:/yq /usr/local/bin/yq
# Make yq executable
chmod +x /usr/local/bin/yq
# Verify that yq is working
yq --version
NOTE

CLI 使用了一些打包在 NetObserv Operator 中的镜像,但它运行时并不要求安装 NetObserv Operator。 准备好 CLI 后,如果你不再需要 NetObserv Operator,可以将其卸载。CLI 仍然可以继续工作。

查看帮助信息

在开始捕获任务之前,请先查看可用命令:

# Get help message for the CLI
kubectl netobserv help
# Get help message for packet capture command
kubectl netobserv packets help
# Get help message for flow capture command
kubectl netobserv flows help

捕获数据包

数据包捕获会记录与所指定过滤条件匹配的原始数据包。 当你需要完整的数据包详情而不是汇总后的流记录时,请使用数据包捕获。

NOTE

如果数据包长度大于 256 字节,数据包在捕获结果中会被截断。

捕获到的数据包可以导出为 pcapng 文件,以便使用 Wireshark 等工具进行离线分析。

Wireshark 中的示例:
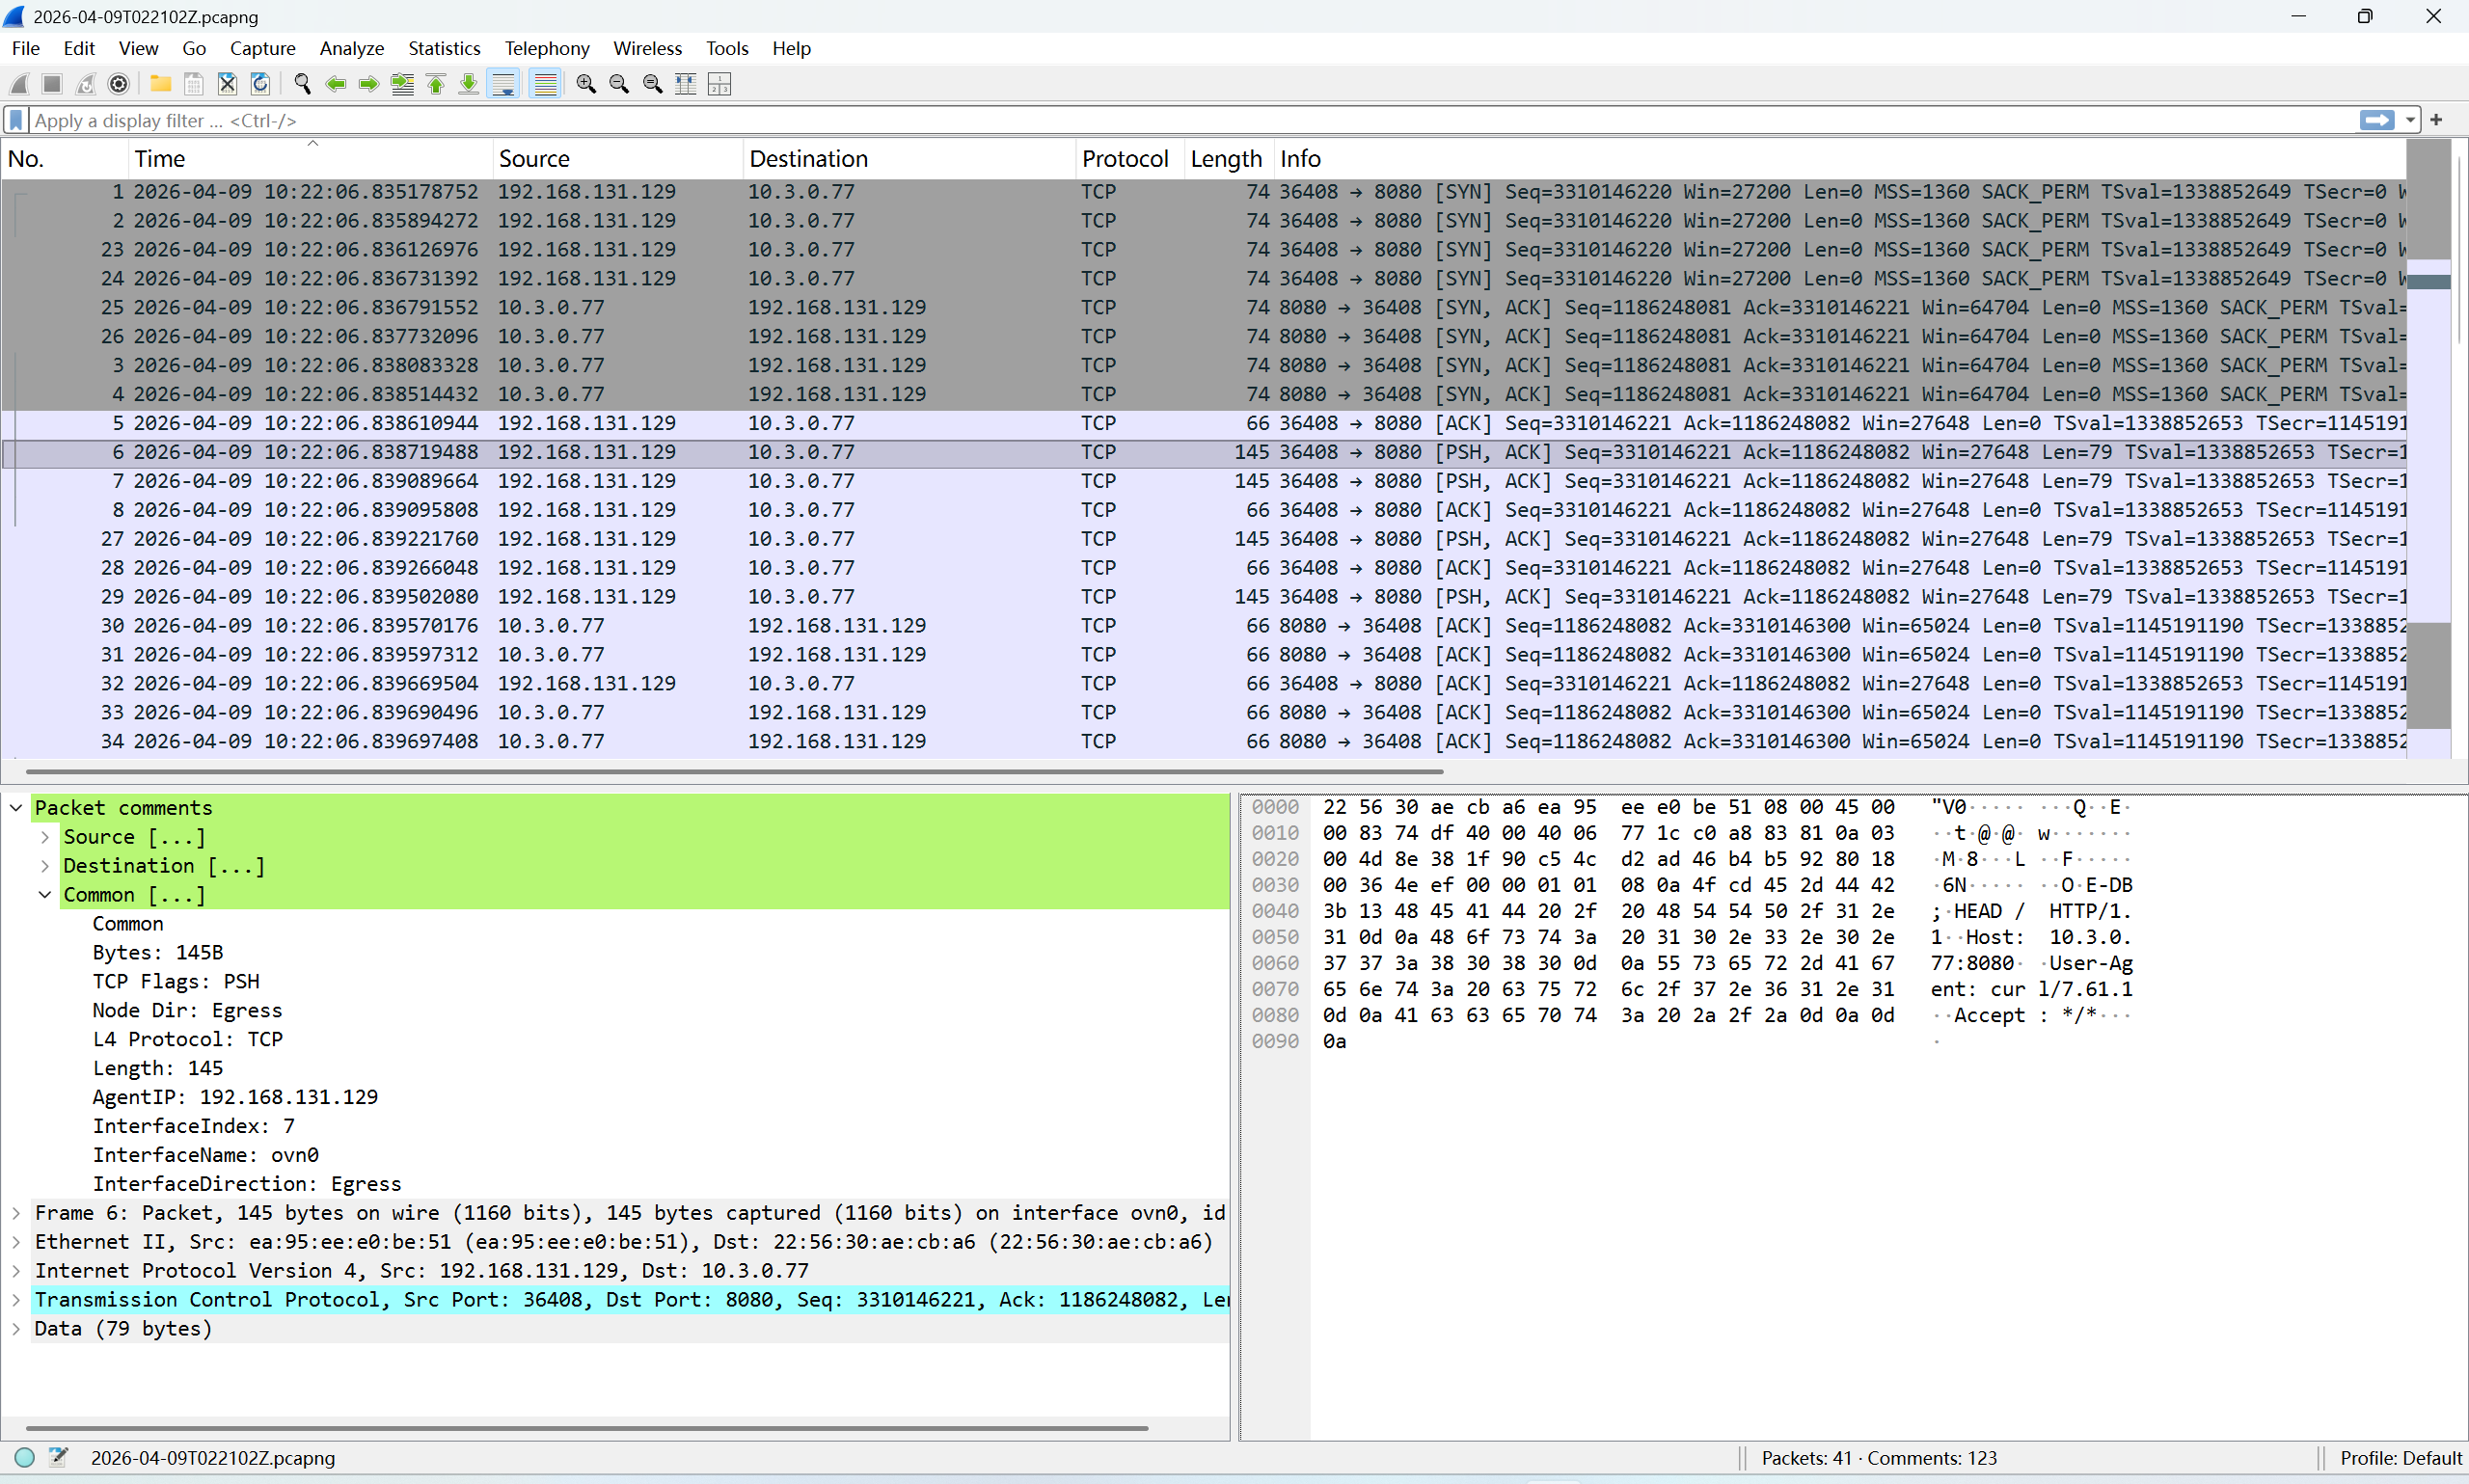
Wireshark

NOTE

pcapng 文件中的捕获数据包不会按时间戳排序,因此你可能需要在 Wireshark 中按时间戳对数据包排序,以分析数据包流。

数据包注释包含节点 IP、接口名称以及 Kubernetes 资源信息等元数据。 数据包注释示例:

Source
    Source
    Src IP: 192.0.2.10
    Src Node IP: 192.0.2.10
    Src Node Name: node-a
    Src Name: node-a
    Src Network Name: primary
    Src Owner: node-a
    Src Owner Kind: Node
    Src Kind: Node
    Src MAC: 02:00:00:00:00:10
    Src Port: 36408
Destination
    Destination
    Dst IP: 198.51.100.77
    Dst Node IP: 192.0.2.20
    Dst Node Name: node-b
    Dst Name: kube-ovn-pinger-js87q
    Dst Namespace: kube-system
    Dst Network Name: ovn-default
    Dst Owner: kube-ovn-pinger
    Dst Owner Kind: DaemonSet
    Dst Kind: Pod
    Dst MAC: 02:00:00:00:00:20
    Dst Port: 8080(http-alt)
Common
    Common
    Bytes: 145B
    TCP Flags: PSH
    Node Dir: Egress
    L4 Protocol: TCP
    Length: 145
    AgentIP: 192.0.2.10
    InterfaceIndex: 7
    InterfaceName: ovn0
    InterfaceDirection: Egress

你可以在 Wireshark 中基于这些注释过滤数据包。 按节点 IP 和接口名称过滤的示例:

frame.comment == "AgentIP: 192.0.2.10" && frame.comment == "InterfaceName: ovn0"

在 Kube-OVN overlay networking 中,不同节点上的 pod 之间的数据包会使用 Geneve 或 VxLAN 进行封装。 原始数据包作为 Geneve 或 VxLAN 数据包的有效载荷传输。 要捕获封装流量,请在运行数据包捕获命令时使用 --enable_geneve--enable_vxlan

包含 Geneve 封装数据包的 8080 端口 TCP 数据包捕获示例命令:

kubectl netobserv packets --enable_geneve --protocol=TCP --port=8080

以 TUI 模式运行数据包捕获

TUI 模式示例命令:

kubectl netobserv packets --cidr=198.51.100.77/32 --peer_ip=192.0.2.10 --protocol=TCP --port=8080

此命令会捕获与指定过滤条件匹配的数据包,并在 TUI 模式下显示。

TUI 界面示例:
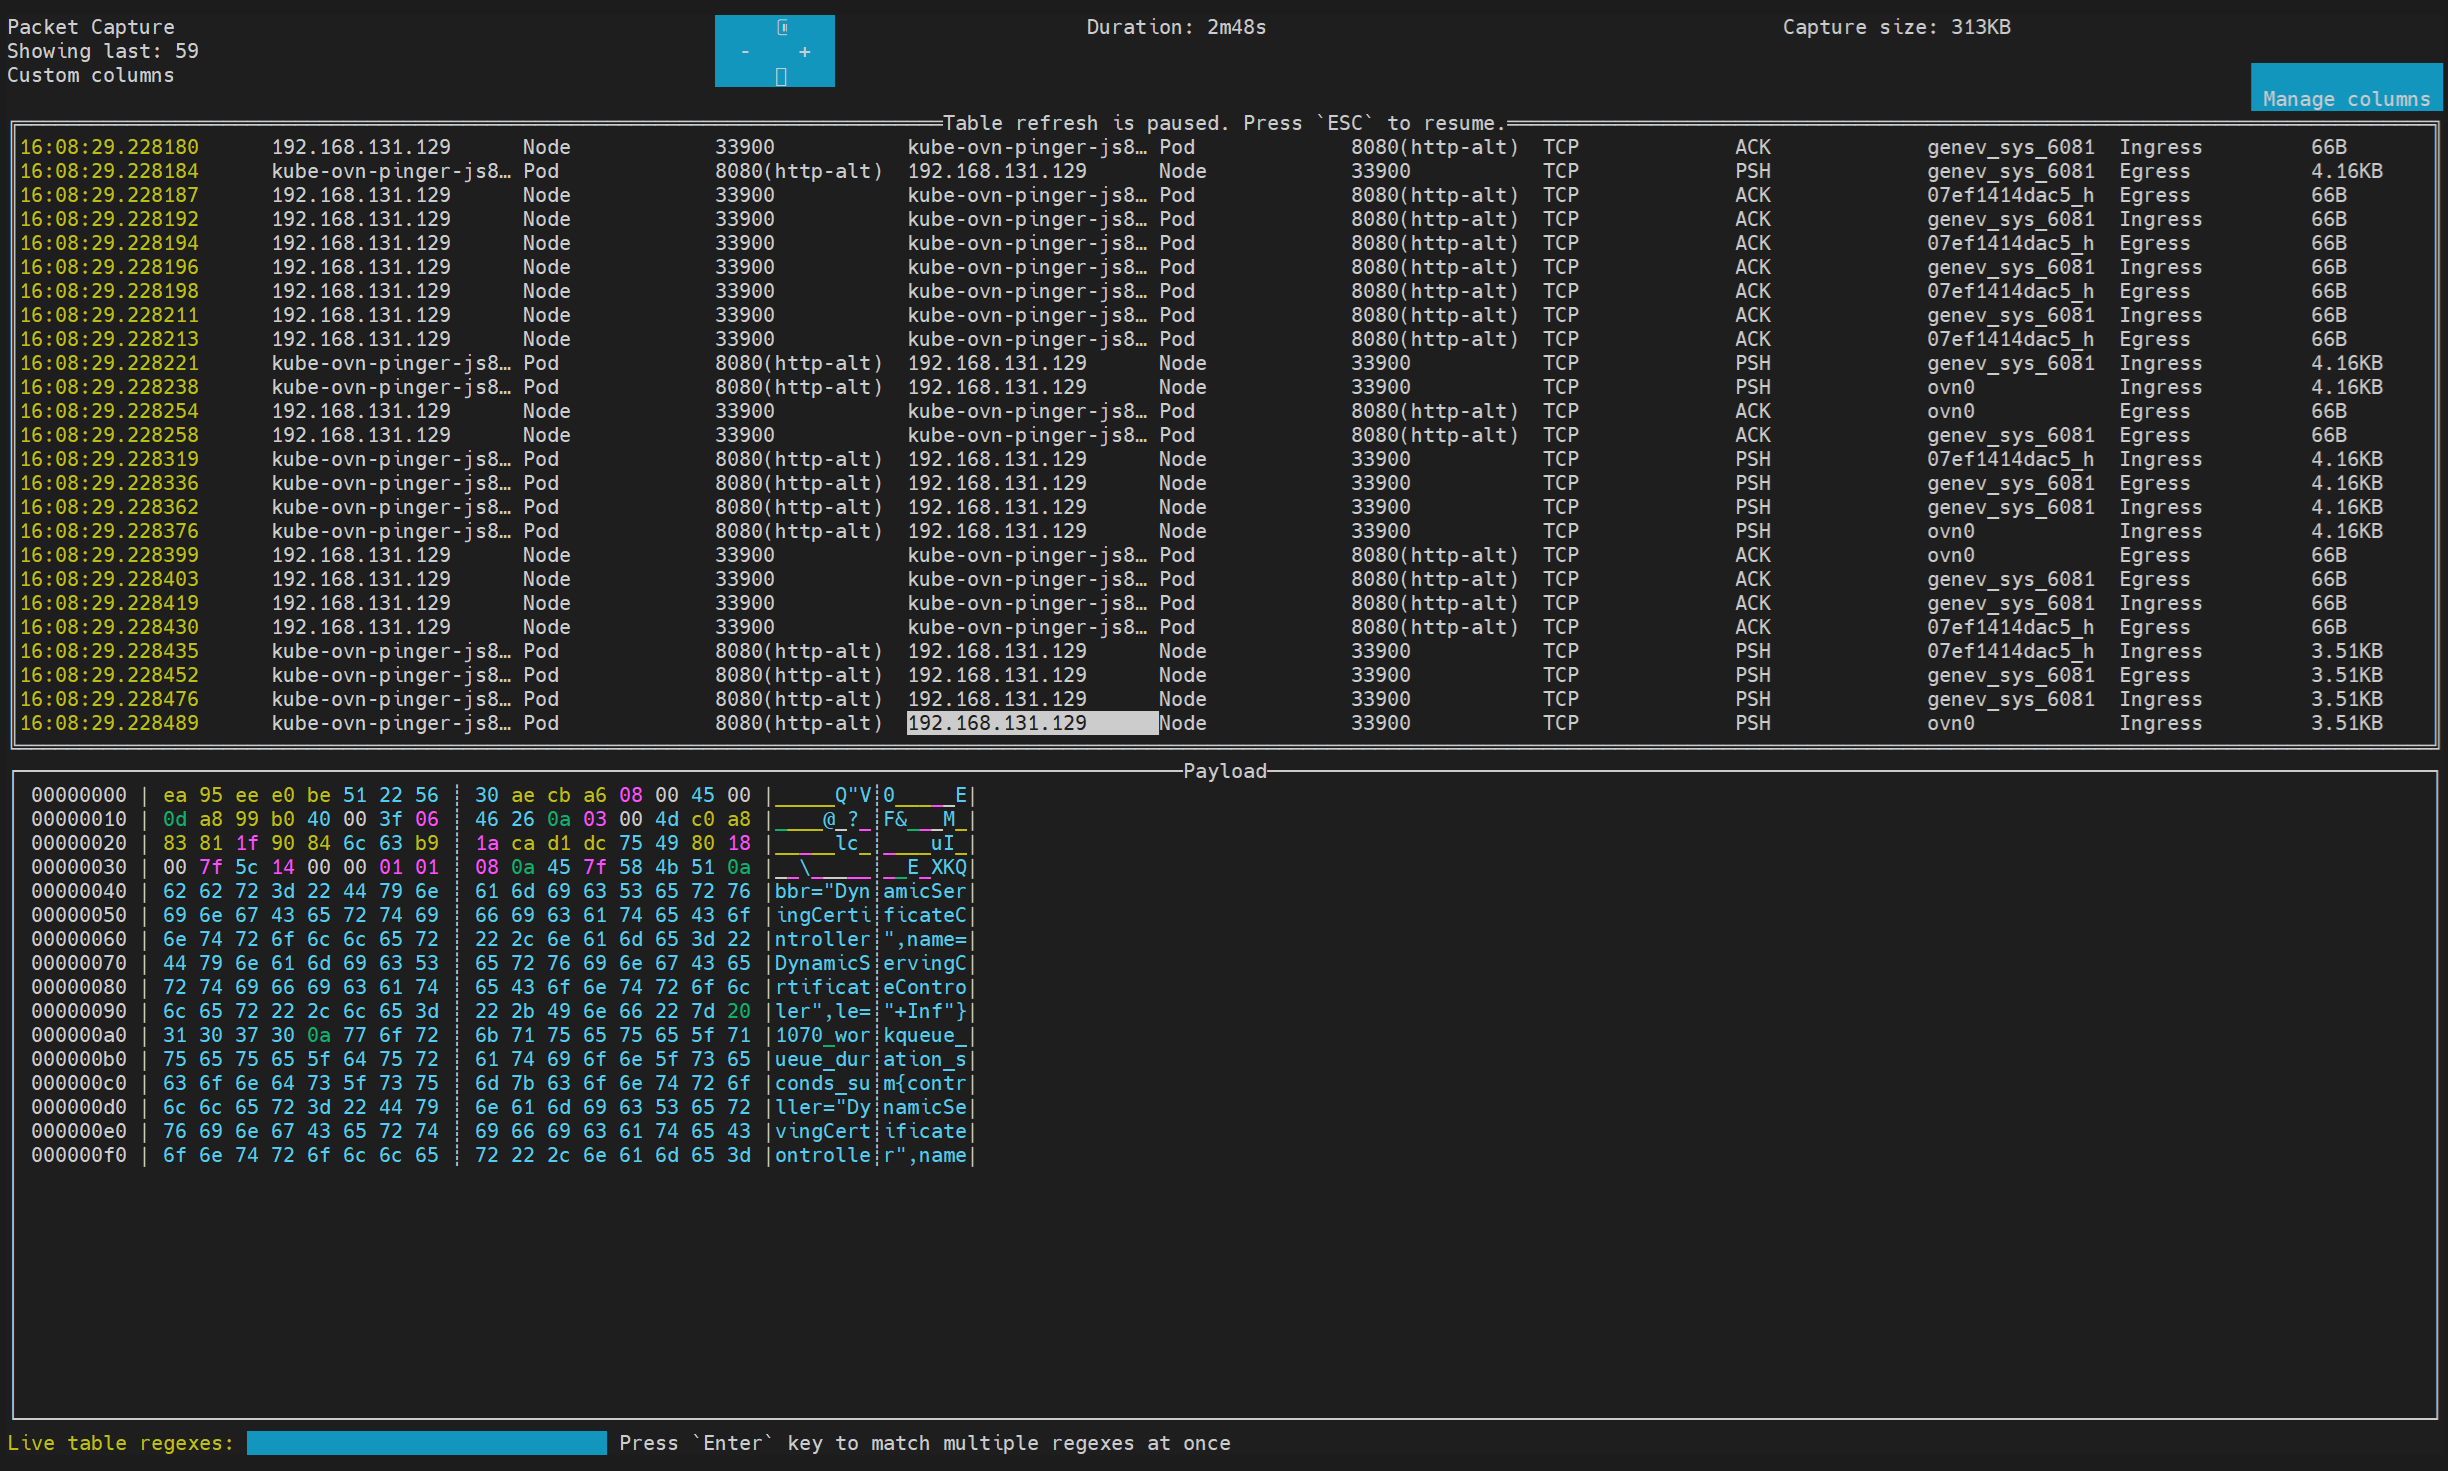
数据包捕获 TUI

CTRL+C 退出 TUI 模式并停止数据包捕获。 默认情况下,你退出 TUI 模式后,CLI 会询问你是否将捕获的数据包导出为 pcapng 文件。 你可以使用 --copy 标志在不确认的情况下自动保存 pcapng 文件。

以后台模式运行数据包捕获

后台模式示例命令:

kubectl netobserv packets --background --cidr=198.51.100.77/32 --peer_ip=192.0.2.10 --protocol=TCP --port=8080

此命令会在后台启动一个数据包捕获任务,用于捕获与指定过滤条件匹配的数据包。

要在后台模式下将捕获的数据包复制到 pcapng 文件,请运行:

kubectl netobserv copy

当捕获任务停止或完成后,你可以使用 cleanup 命令移除后台捕获任务并释放资源。

kubectl netobserv cleanup

捕获流

流捕获记录的是汇总后的网络流数据,而不是原始数据包。 当你需要流量元数据和流统计信息,而不是完整的数据包负载时,请使用它。

流捕获的用法与数据包捕获类似,但结果会以 JSON 和 SQLite 格式导出,而不是 pcapng。

示例命令:

kubectl netobserv flows --cidr=198.51.100.77/32 --peer_ip=192.0.2.10 --protocol=TCP --port=8080

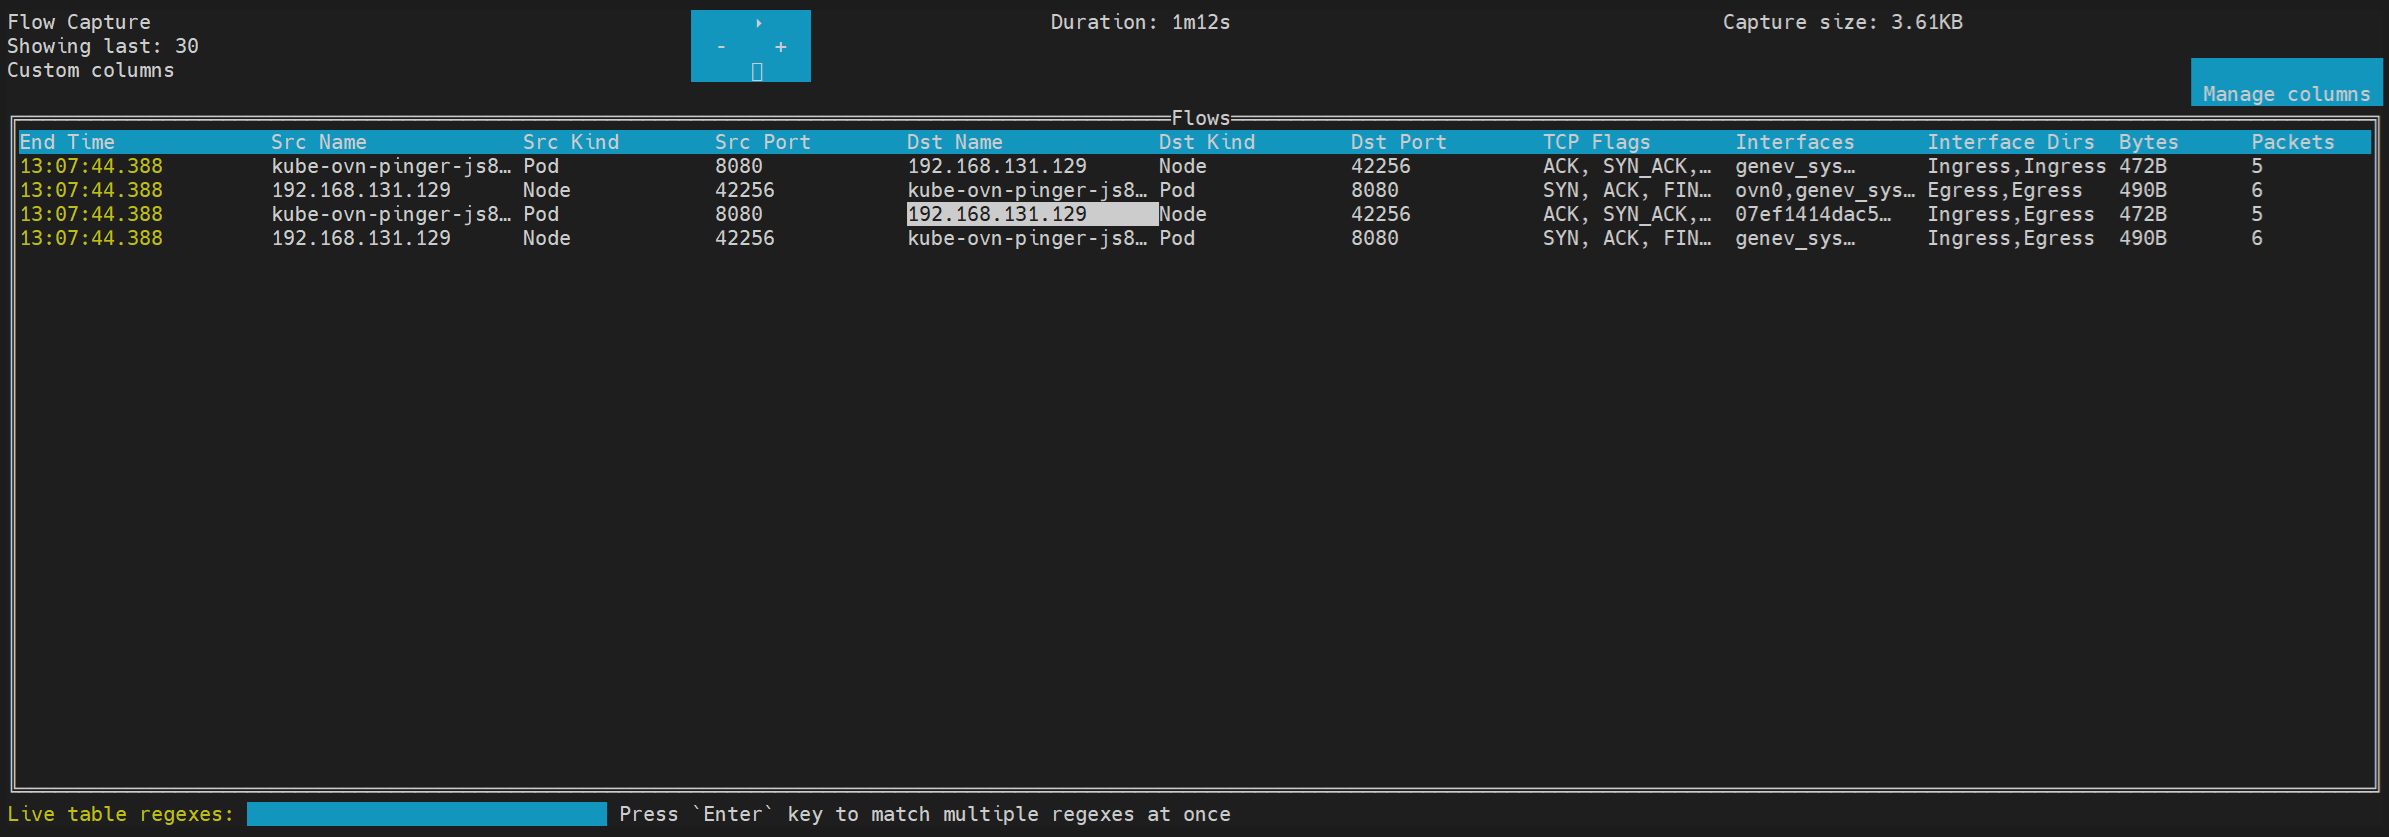
TUI 界面示例:

流捕获 TUI

以格式化 JSON 导出的流记录示例:

[
  {
    "AgentIP": "192.0.2.10",
    "Bytes": 611,
    "Dscp": 0,
    "DstAddr": "2001:db8:1::77",
    "DstK8S_HostIP": "192.0.2.20",
    "DstK8S_HostName": "node-b",
    "DstK8S_Name": "kube-ovn-pinger-2w2qp",
    "DstK8S_Namespace": "kube-system",
    "DstK8S_NetworkName": "ovn-default",
    "DstK8S_OwnerName": "kube-ovn-pinger",
    "DstK8S_OwnerType": "DaemonSet",
    "DstK8S_Type": "Pod",
    "DstMac": "02:00:00:00:00:20",
    "DstPort": 8080,
    "Etype": 34525,
    "Flags": 530,
    "FlowDirection": 2,
    "IfDirections": [
      1,
      1
    ],
    "Interfaces": [
      "ovn0",
      "211daf442f8b_h"
    ],
    "Packets": 6,
    "Proto": 6,
    "Sampling": 1,
    "SrcAddr": "2001:db8:1::10",
    "SrcK8S_HostIP": "192.0.2.10",
    "SrcK8S_HostName": "node-a",
    "SrcK8S_Name": "kube-ovn-cni-zgjhs",
    "SrcK8S_Namespace": "kube-system",
    "SrcK8S_NetworkName": "primary",
    "SrcK8S_OwnerName": "kube-ovn-cni",
    "SrcK8S_OwnerType": "DaemonSet",
    "SrcK8S_Type": "Pod",
    "SrcMac": "02:00:00:00:00:10",
    "SrcPort": 59848,
    "TimeFlowEndMs": 1775701945802,
    "TimeFlowStartMs": 1775701945799,
    "TimeReceived": 1775701946
  },
  {
    "AgentIP": "192.0.2.10",
    "Bytes": 509,
    "Dscp": 0,
    "DstAddr": "2001:db8:1::10",
    "DstK8S_HostIP": "192.0.2.10",
    "DstK8S_HostName": "node-a",
    "DstK8S_Name": "kube-ovn-cni-zgjhs",
    "DstK8S_Namespace": "kube-system",
    "DstK8S_NetworkName": "primary",
    "DstK8S_OwnerName": "kube-ovn-cni",
    "DstK8S_OwnerType": "DaemonSet",
    "DstK8S_Type": "Pod",
    "DstMac": "02:00:00:00:00:30",
    "DstPort": 59848,
    "Etype": 34525,
    "Flags": 784,
    "FlowDirection": 2,
    "IfDirections": [
      0,
      0
    ],
    "Interfaces": [
      "211daf442f8b_h",
      "ovn0"
    ],
    "Packets": 4,
    "Proto": 6,
    "Sampling": 1,
    "SrcAddr": "2001:db8:1::77",
    "SrcK8S_HostIP": "192.0.2.20",
    "SrcK8S_HostName": "node-b",
    "SrcK8S_Name": "kube-ovn-pinger-2w2qp",
    "SrcK8S_Namespace": "kube-system",
    "SrcK8S_NetworkName": "ovn-default",
    "SrcK8S_OwnerName": "kube-ovn-pinger",
    "SrcK8S_OwnerType": "DaemonSet",
    "SrcK8S_Type": "Pod",
    "SrcMac": "02:00:00:00:00:40",
    "SrcPort": 8080,
    "TimeFlowEndMs": 1775701945802,
    "TimeFlowStartMs": 1775701945800,
    "TimeReceived": 1775701946
  }
]

以 SQLite 导出的流记录示例:

$ sqlite3 2026-04-09T022936Z.db \
  "SELECT SrcAddr, SrcPort, DstAddr, DstPort, Proto, Packets, Bytes FROM flow;"
╭───────────────────────┬─────────┬───────────────────────┬─────────┬───────┬─────────┬───────╮
        SrcAddr SrcPort        DstAddr DstPort Proto Packets Bytes
╞═══════════════════════╪═════════╪═══════════════════════╪═════════╪═══════╪═════════╪═══════╡
 2001:db8:1::10   59848 2001:db8:1::77    8080     6       6   611
 2001:db8:1::77    8080 2001:db8:1::10   59848     6       4   509
╰───────────────────────┴─────────┴───────────────────────┴─────────┴───────┴─────────┴───────╯

其他资源